Product Description
Outlook
The Single Quantum Retina is an advanced, rack-mountable, and stackable electronics driver designed specifically for Superconducting Nanowire Single-Photon Detectors (SNSPDs). It serves as the central control unit, allowing users to manage bias currents, monitor SNSPD photoresponse, check cryostat temperature, and verify overall system functionality with ease.
The Retina system is highly scalable, accommodating multiple extension units to handle numerous SNSPD channels simultaneously. With a user-friendly, browser-based interface, the Retina driver eliminates the need for additional software installation, offering a seamless experience.
Software
The Single Quantum Retina provides a groundbreaking user interface that effortlessly combines hardware and software, enabling the management of hundreds or even thousands of detector channels from a single platform. This advanced, browser-based software is designed to be resilient against crashes, ensuring uninterrupted hardware operation even if software issues arise.
Designed with importance of its applications in mind, the Retina system is easy to maintain and upgrade, ensuring long-term efficiency with minimal effort. The driver software is optimized for convenience and efficiency, requiring no installation and operating independently of your device, operating system, or location. This means that control is always at your fingertips, whether you’re using a desktop, tablet, or smartphone.
The software interface is organized into three primary tabs, each designed for easy access to specific features. The Home tab focuses on the core functionality, providing real-time countrate readout along with tools for adjusting operating current and trigger levels. The second tab, named the Tune tab, is designed to quickly determine the optimal operating current for the detectors by performing a current sweep. Lastly, the Settings tab consolidates all hardware and software configuration options in one location. Additionally, temperature readout of the system can be accessed from any of the listed tabs within the software. Detailed explanations of each tab are provided in the following sections.
Home tab
The home tab of the Retina software provides access to all the essential tools for operating the detectors and reading out their signals - Fig. Software home tab.. A user-friendly real-time graph is featured, offering two plot types that cater to various tasks and the number of channels in use, ensuring versatile and task-oriented data readout (Fig. Available plot types for real-time countrate graph.). For each detector, users can set the desired bias current, adjust the trigger level, and record count rate data over time. Screenshots of the data can be quickly downloaded. The graphs also support semi-log scaling, providing a clear and precise representation of the data.
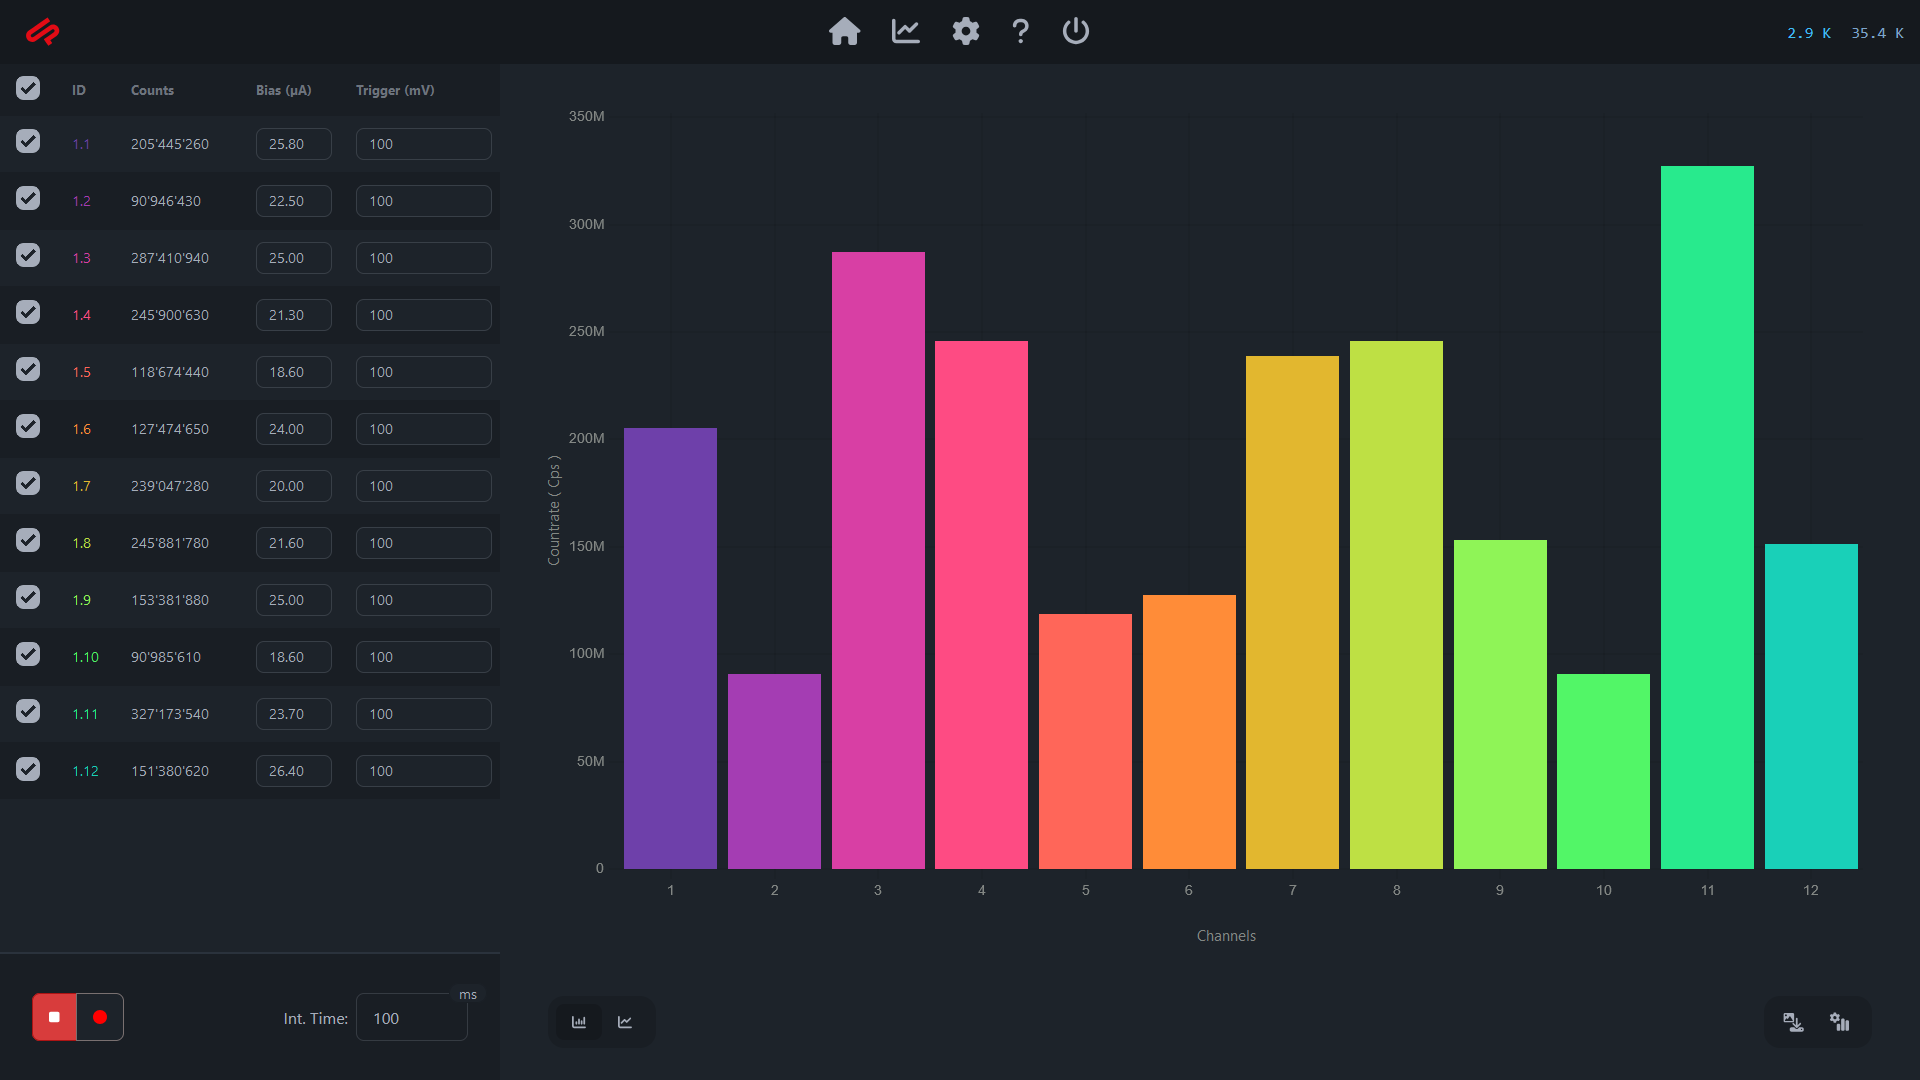
Software home tab.
The panel on the left side of home tab (Fig. Home tab features.) provides controls for adjusting operating currents and trigger levels individually for all detector channels. In the same panel integration time could be set between 10 ms and 60 s. Users can also enable graph recording and save it as a .json data file from the lower part of the panel. Detector channels have unique IDs, allowing users to select which channels to display on the graph and easily differentiate them by their color codes. Additionally, the panel shows the countrates for each channel, averaged over the set integration time. If pressed, count rate value will expand and could be dragged around the screen allowing convenient value readout even from a distance from the screen.
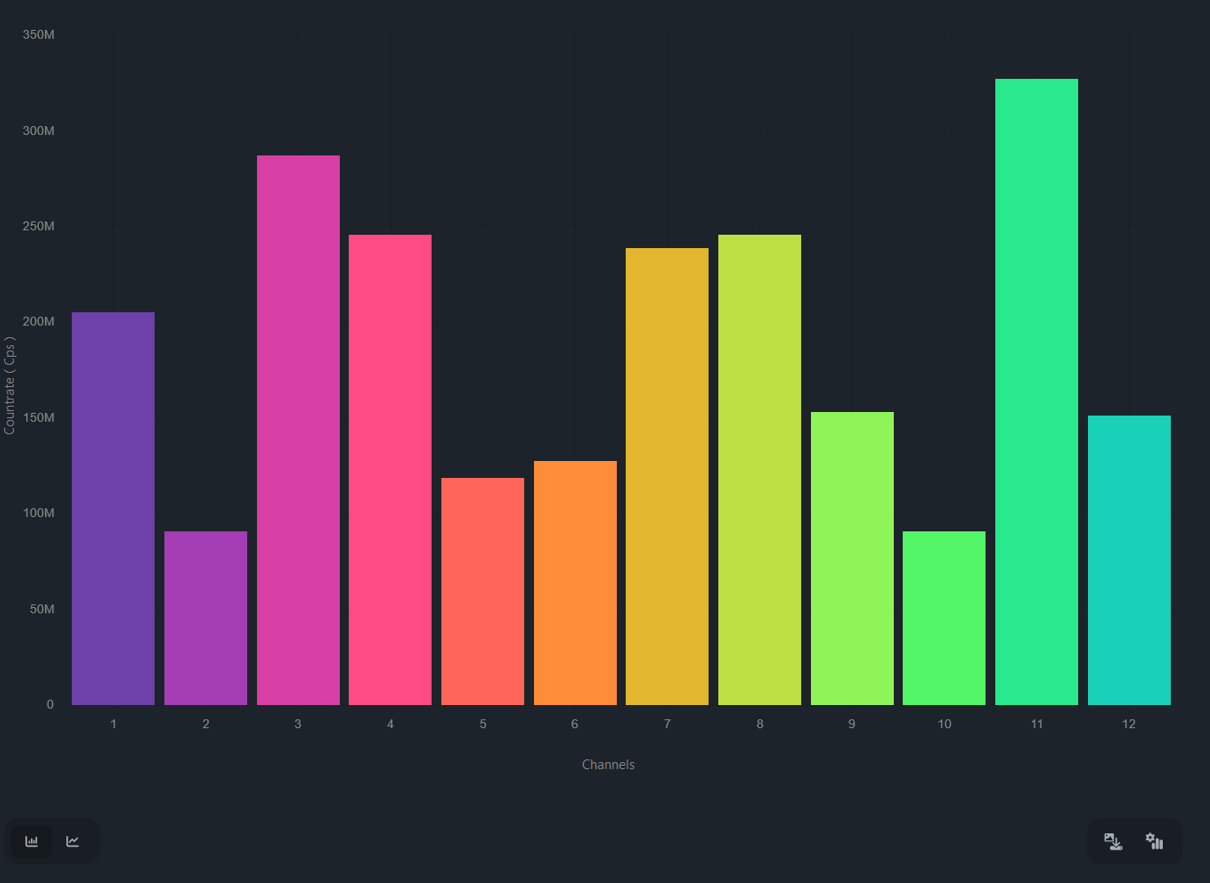
Available plot types for real-time countrate graph.
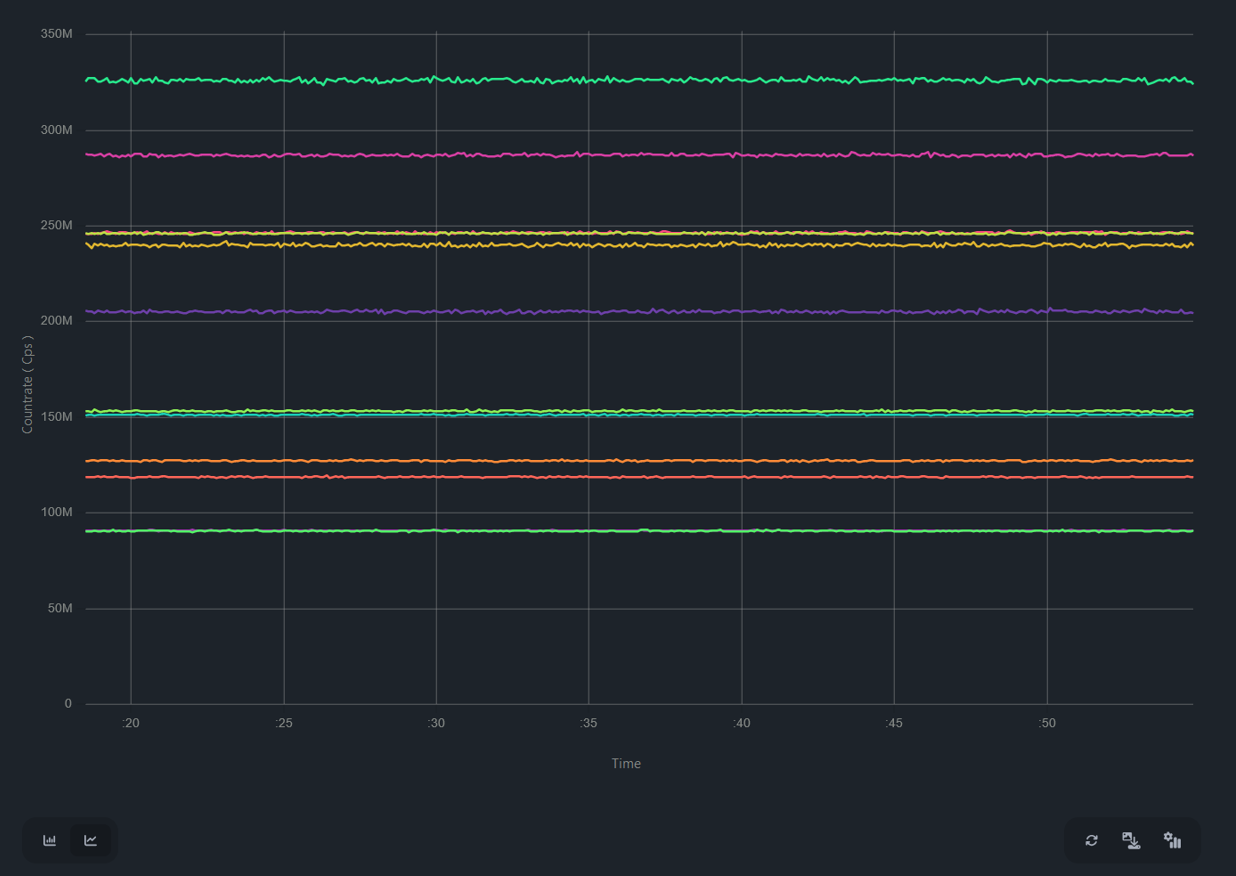
The icons below the graph allow you to switch between different graph types, save the graph as a .png file, and access graph settings (Fig. Home tab icons.). In the graph settings section the user may choose semi-logarithmic scale, turn off automatic graph bounds, disable grids for linear plot, and change duration of the time window. Additionally, one can enable High Performance Mode, which simplifies plotting and reduces CPU load, along with count rate normalization.
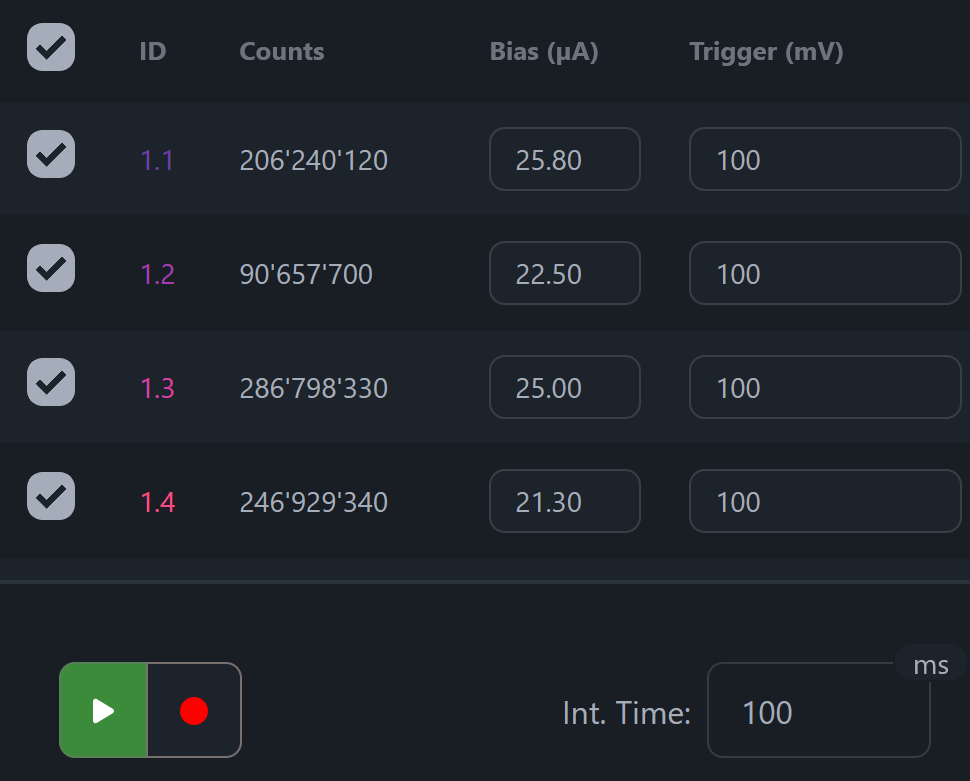
Home tab features.
Home tab icons.
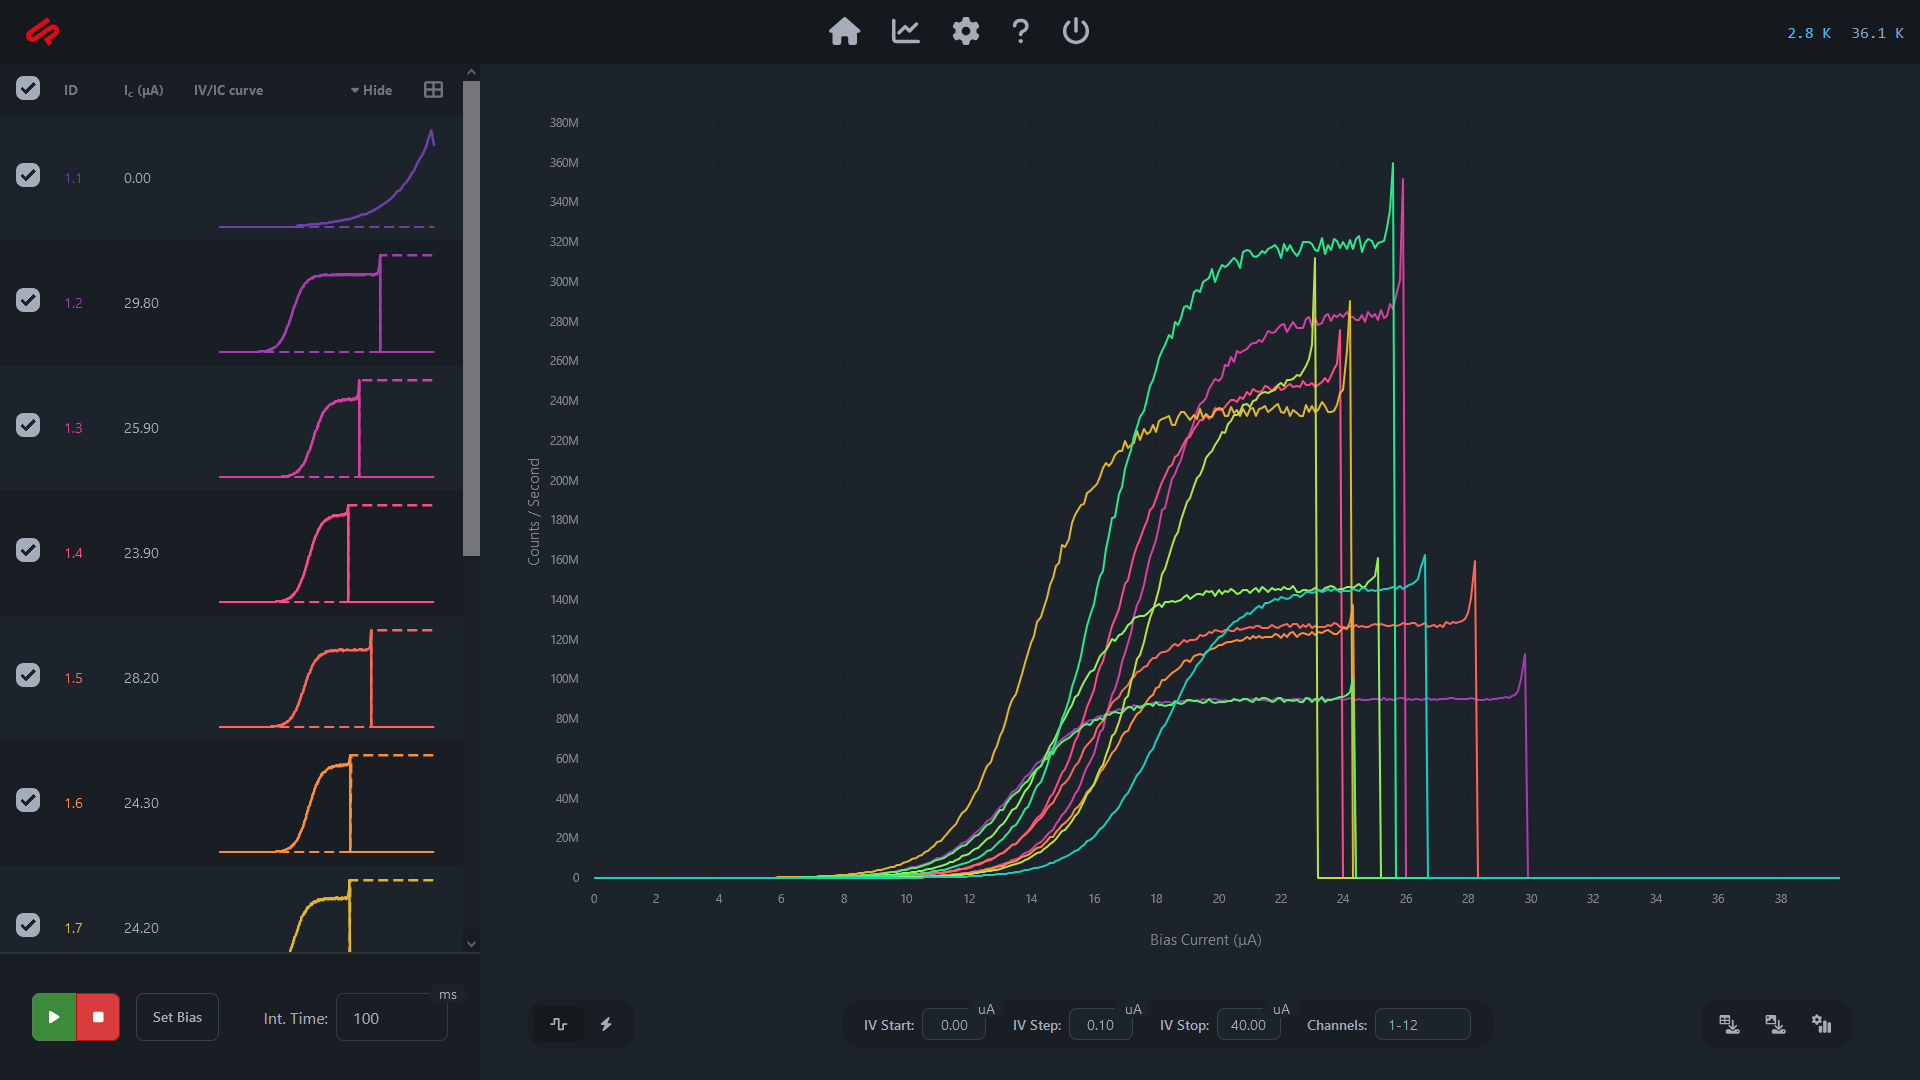
Sweep tab
Similar to the Home tab, the Sweep tab offers an intuitive and clear graphical data representation along with a control panel. Since the performance of SNSPDs is heavily dependent on the bias current operating point, this tab is designed to allow users to easily sweep the current across all detectors simultaneously to find optimal bias current values. The graph and control panel display both the IV curve and counts versus bias current for all channels (Fig. Available data visualization). Together with counts from detectors, from the sweep IV curves for detectors are plotted which allows to diagnose any issues with detector channels.
When no optical fibers are connected to the system and the optical inputs are capped, the user can perform a current sweep with an integration time of 1 second or longer. The exact duration depends on the desired resolution of the dark count rate and the acceptable level of statistical error. By setting the start and stop currents for the IV sweep and specifying the step value, the user can initiate the process by pressing the play button. The system will then conduct the sweep, plotting the IV curves along with the detectors’ dark count rate as a function of the applied bias current. This allows the user to select an appropriate operating current based on the maximum allowable dark count rate. Another critical metric derived from the sweep is the critical, or superconductivity-breaking, current, which can vary between detectors.
When optical fibers are connected and the system receives input light, the user can perform an additional sweep to determine if the input light shifts the detectors’ critical current. This shift, known as the switching current, should be considered when choosing a suitable new operating current for the detectors under the current illumination.
Available data visualization
Settings tab
The Settings tab contains several sections, not all of which are intended for frequent use by the user. These sections are primarily designed to configure the hardware and process information correctly. However, the following provides a brief summary of each available section in the Settings tab.
Channels: Contains information and settings for each Retina unit and its internal modules.
Configuration: Specifies values for amplification and bias circuits.
Bias Resistors: Sets offsets for the biasing/readout circuit.
Rack Configuration: Allows the connection of additional Retina units.
Properties:
System: Provides access to various properties, including software updates, system configuration, network settings, time zone, and temperature sensor calibration.
View: Enables customization of the appearance of the main software tabs.
Log: Displays logs for all connected units.